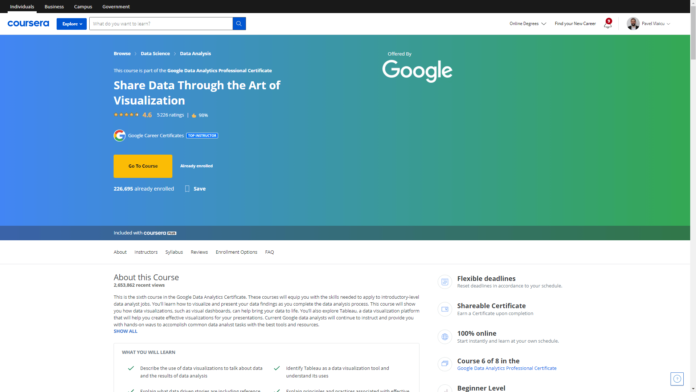
About this Course
This is the sixth course in the Google Data Analytics Certificate. These courses will equip you with the skills needed to apply to introductory-level data analyst jobs. You’ll learn how to visualize and present your data findings as you complete the data analysis process. This course will show you how data visualizations, such as visual dashboards, can help bring your data to life. You’ll also explore Tableau, a data visualization platform that will help you create effective visualizations for your presentations. Current Google data analysts will continue to instruct and provide you with hands-on ways to accomplish common data analyst tasks with the best tools and resources.
Learners who complete this certificate program will be equipped to apply for introductory-level jobs as data analysts. No previous experience is necessary.
By the end of this course, you will:
– Examine the importance of data visualization.
– Learn how to form a compelling narrative through data stories.
– Gain an understanding of how to use Tableau to create dashboards and dashboard filters.
– Discover how to use Tableau to create effective visualizations.
– Explore the principles and practices involved with effective presentations.
– Learn how to consider potential limitations associated with the data in your presentations.
– Understand how to apply best practices to a Q&A with your audience.
What you will learn
Describe the use of data visualizations to talk about data and the results of data analysis
Identify Tableau as a data visualization tool and understand its uses
Explain what data driven stories are including reference to their importance and their attributes
Explain principles and practices associated with effective presentations
Skills you will gain
Data Analysis
Tableau Software
Data Visualization (dataviz)
Presentation
Instructor
Google Career Certificates
Offered by
Google Career Certificates are part of Grow with Google, an initiative that draws on Google’s 20-year history of building products, platforms, and services that help people and businesses grow. Through programs like these, we aim to help everyone– those who make up the workforce of today and the students who will drive the workforce of tomorrow – access the best of Google’s training and tools to grow their skills, careers, and businesses.
Syllabus – What you will learn from this course
Week 1
Visualizing data
Data visualization is the graphical representation of data. In this part of the course, you’ll be introduced to key concepts, including accessibility, design thinking, and other factors that play a role in visualizing the data in your analysis.
Week 2
Creating data visualizations with Tableau
Tableau is a tool that helps data analysts create effective data visualizations. In this part of the course, you’ll learn all about Tableau and explore the importance of creativity and clarity while visualizing your data analysis findings.
Week 3
Crafting data stories
Connecting your objective with your data through insights is essential to good data storytelling. In this part of the course, you’ll learn about data-driven stories and their attributes. You’ll also gain an understanding of how to use Tableau to create dashboards and dashboard filters.
Week 4
Developing presentations and slideshows
In this part of the course, you’ll discover how to give an effective presentation about your data analysis. You’ll consider all aspects of your analysis when creating the presentation, as well as how to create clear, accessible, and convincing data visualizations. In addition, you’ll learn how to anticipate and respond to potential limitations and questions that may arise.
About the Google Data Analytics Professional Certificate
Prepare for a new career in the high-growth field of data analytics, no experience or degree required. Get professional training designed by Google and have the opportunity to connect with top employers. There are 380,000 U.S. job openings in data analytics with a $74,000 median entry-level salary.
Data analytics is the collection, transformation, and organization of data in order to draw conclusions, make predictions, and drive informed decision making. Over 8 courses, gain in-demand skills that prepare you for an entry-level job. You’ll learn from Google employees whose foundations in data analytics served as launchpads for their own careers. At under 10 hours per week, you can complete the certificate in less than 6 months. You’ll prepare yourself for jobs that include junior or associate data analyst, database administrator, and more. Upon completion of the certificate, you can directly apply for jobs with Google and over 150 U.S. employers, including Walmart, Best Buy, Astreya. 75% of Google Career Certificate Graduates in the United States report an improvement in their career trajectory (e.g. new job or career, promotion or raise) within 6 months of certificate completion US Burning Glass Labor Insight Report salary data (median with 0-5 years experience) and job opening data. Data for job roles relevant to featured programs (4/01/2021 – 3/31/22). Based on program graduate survey responses, United States 2021
